Challenge of Wits 2023
Writeup on Challenge of Wits 2023.
For over 6 weeks, Singaporeans with a passion for Science & Technology participated in the Challenge of Wits 2023. More than 1,200 participants tested their intellect by solving challenges created by defence technology experts from DSTA, CSIT, and DSO.
This was a great opportunity to apply various skills I have acquired over the years, such as statistics, scripting, and the use of LLMs. I had a fantastic time and thoroughly enjoyed the process of solving these challenges.
CHALLENGE 1: Command, Control and Communications
In DSTA, we built a C3 system to track drones and to ensure drones fly within the permitted height limit. We use GPS positioning to determine the height of drones in flight. As there are many things that can degrade the accuracy of GPS positioning (e.g. satellite signals being reflected off buildings), we need to add a buffer on top of the permitted height limit to ensure that drones flying over the height limit are correctly identified as errant drones.
Given that the GPS height positioning accuracy is 13m at 95% confidence and the error mean is 0, using Confidence Interval Formula to solve this question, what buffer would you recommend to have a false positive rate of 0.15%?
The following screenshot shows the Confidence Interval (CI) Formula.
For 95% Confidence Interval, Z-Score is 1.96.
Rewriting the formula, s/(n^0.5) is given by 13/1.96, which is 6.63265 (5dp).
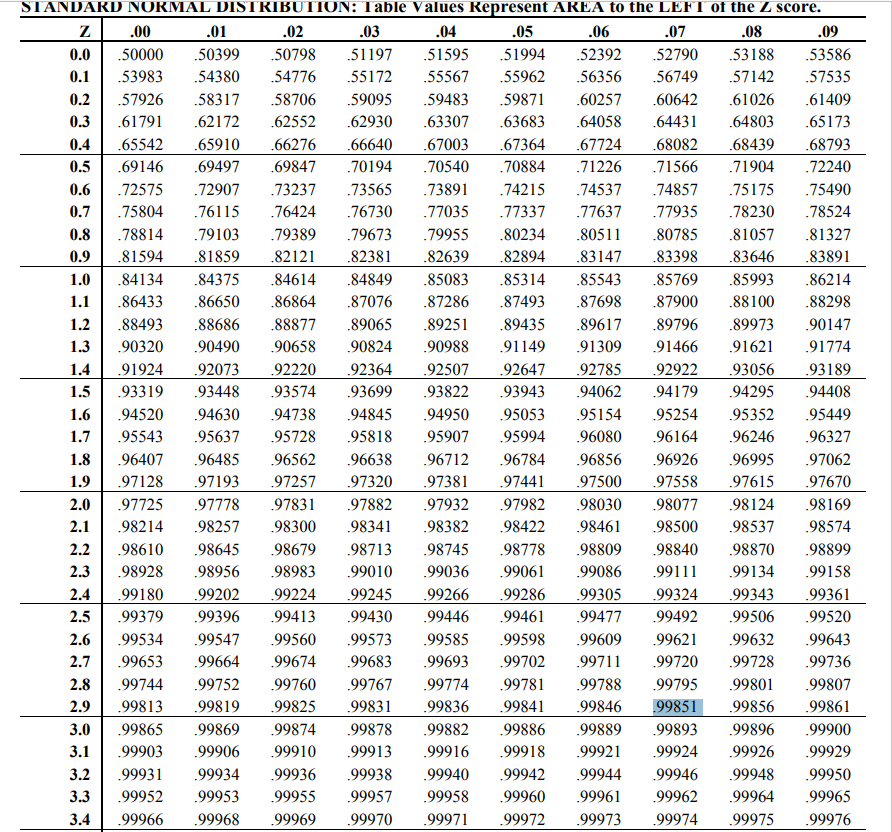
Refer to Standard Normal Distribution Table.
For false positive rate of 0.15%, look up 0.9985 in the table.
The Z-Score is 2.9 (from left of table) + 0.07 (from top of table), which is 2.97.
Plugging Z-score = 2.97 and s/(n^0.5) = 6.63265 into the CI Formula, buffer = 2.97*6.63265 = 19.69897 (5dp).
Therefore, to identify errant drones with a false positive rate of 0.15% under the circumstances that GPS height positioning accuracy is 13m at 95% confidence and the error mean is 0, the buffer zone needs to be plus 19.69897m from permitted height.
Round answer in meters to nearest whole number means answer is 20.
CHALLENGE 2: Data Science
Millions of stolen cash was stashed away by terror organisation APOCALYPSE in their safe. A thumb drive
Logs.zipwith log files was recovered when they were captured. Handed to you, your team’s mission is to find the secret key from theLogs.zipfiles that will unlock the safe to recover the stolen cash.Armed with programming expertise and knowledge of text processing, you know how best to represent insights from data to answer mission requirements. You are told APOCALYPSE used a 2D shape as their secret key.
Can you find the secret key to unlock the safe?
- Hint 1: Download
Logs.zipfrom the challenge website.- Hint 2: Write a script to solve the challenge.
Downloadable File SHA256 checksum Logs.zip 1de1f6e7de75cf3cb62898b0186753b4464c7d26ecff662e1b61343111b7cffb
Checked the logs and they were mostly gibberish. The only field that stood out was location.
Used ChatGPT with the following prompts to produce the required python script.
1
2
3
I need help writing a python script.
Given multiple xml files, I need to extract the x,y coordinates from <location>x,y</location>.
Instead of printing the coordinates, plot them on a graph.
1
2
3
4
5
6
7
8
9
10
11
12
13
14
15
16
17
18
19
20
21
22
23
24
25
26
27
28
29
30
31
32
33
34
35
36
37
38
39
40
41
42
43
44
import os
import xml.etree.ElementTree as ET
import matplotlib.pyplot as plt

def extract_coordinates_from_xml(xml_path):
    try:
        tree = ET.parse(xml_path)
        root = tree.getroot()

        coordinates = []

        for location_element in root.findall(".//location"):
            if location_element.text:
                x, y = location_element.text.split(',')
                coordinates.append((float(x), float(y)))

        return coordinates

    except ET.ParseError as e:
        print(f"Error parsing {xml_path}: {e}")
        return []

def main():
    folder_path = "."
    output_coordinates = []

    for filename in os.listdir(folder_path):
        if filename.endswith(".xml"):
            xml_path = os.path.join(folder_path, filename)
            coordinates = extract_coordinates_from_xml(xml_path)
            output_coordinates.extend(coordinates)

    x_values = [x for x, y in output_coordinates]
    y_values = [y for x, y in output_coordinates]

    plt.scatter(x_values, y_values, color='blue')
    plt.xlabel('X Coordinate')
    plt.ylabel('Y Coordinate')
    plt.title('Coordinates from XML Files')
    plt.grid(True)
    plt.show()

if __name__ == "__main__":
    main()
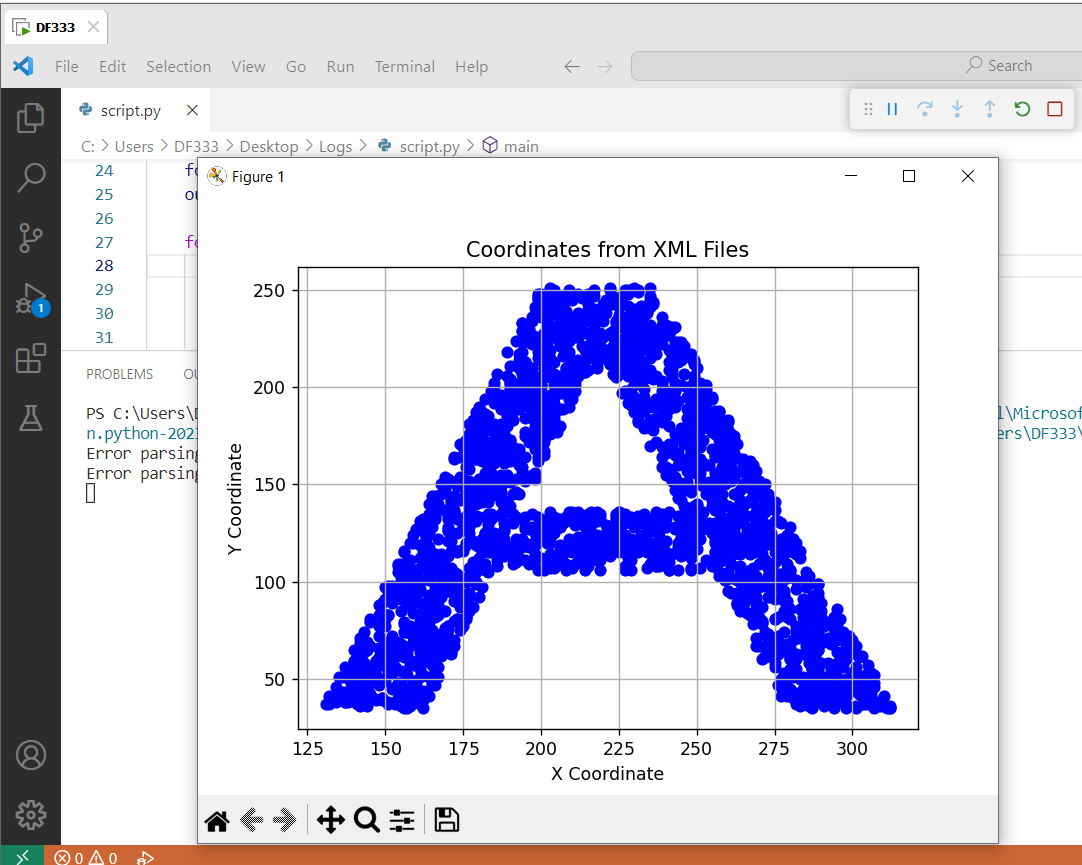
Placed the python script in the Logs folder and ran it.
The secret key presents itself as A.
CHALLENGE 3: Robotic Autonomy
For this challenge, we will consider a robot that needs to move from its current position to a goal position across challenging terrain, avoiding obstacles along the way and conserving as much energy as possible.
Download the elevation map of the terrain
Elevation.csvfrom the challenge website to get started. The map is on a grid made out of cells with integer coordinates, where the robot can move from each cell (x, y) to any of its 8 neighbours, (x + a, y + b) where−1 ≤ a ≤ 1,−1 ≤ b ≤ 1,|a| + |b| ≥ 1.The robot starts from (0, 0) . What is the robot’s lowest cost to reach the goal position (90, 50)? Round the lowest cost to 1 decimal place.
Within the elevation map:
- The first row gives the x-coordinate scale.
- The first column gives the y-coordinate scale.
- Other values give elevation, in meters.
The energy cost of taking a step is the sum of horizontal cost and climbing cost, where:
- Horizontal cost: (a^2 + b^2)^0.5
- Climbing cost: 10 times the increase in elevation in meters (no climbing cost if going to the same or lower elevation)
Examples:
- Taking a step from (0, 0) which has an elevation of 7.9 to (1, 1) which has an elevation of 8.5 will cost (2^0.5)+6, or roughly 7.41 units.
- Taking a step from (0, 0) which has an elevation of 7.9 to (0, -1) which has an elevation of 7.5 will cost 1 unit.
Downloadable File SHA256 checksum Elevation.csv 3d5fb42c3feaa06efafe3f050337257ae877c57c9306599021d0b60dcacce9bc
Did some research before deciding to implement the following steps:
- Read the data from
Elevation.csv - Apply weight calculation formula
- Store calculated weights in an appropriate data format (adjacency matrix)
- Utilise Dijkstra’s Algorithm to determine the shortest path
- Script shall be designed to function by providing a starting point (x, y) and an ending point (x’, y’)
ChatGPT was used to provide various code snippets to work with.
Due to interesting constraints such as boundaries of map (not all nodes have the same number of edges) and varying energy costs due to elevation differences (edges have different weights), I had to manually write some portions of the script.
1
2
3
4
5
6
7
8
9
10
11
12
13
14
15
16
17
18
19
20
21
22
23
24
25
26
27
28
29
30
31
32
33
34
35
36
37
38
39
40
41
42
43
44
45
46
47
48
49
50
51
52
53
54
55
56
57
58
59
60
61
62
63
64
65
66
67
68
69
70
import heapq
import csv

def dijkstra(graph, start, end):
    # Initialize distances and priority queue
    distances = {vertex: float('infinity') for vertex in graph}
    distances[start] = 0
    priority_queue = [(0, start)]

    while priority_queue:
        current_distance, current_vertex = heapq.heappop(priority_queue)

        # Skip if this vertex has been visited before with a shorter distance
        if current_distance > distances[current_vertex]:
            continue

        for neighbor, weight in graph[current_vertex].items():
            distance = current_distance + weight
            if distance < distances[neighbor]:
                distances[neighbor] = distance
                heapq.heappush(priority_queue, (distance, neighbor))

    # If the end vertex was reached, return its distance
    if distances[end] != float('infinity'):
        return distances[end]
    else:
        return None

# Initialize adjacency matrix
graph = {}
directions = [(x, y) for x in [1, 0, -1] for y in [1, 0, -1] if not (x == 0 and y == 0)]
with open('Elevation.csv', 'r') as file:
    csv_reader = csv.reader(file)
    all_rows = [row for row in csv_reader]
    x_index = [x for x in all_rows[0]]
    y_index = [row[0] for row in all_rows]
    for x in x_index:
        if x == '':
            continue
        else:
            for y in y_index:
                if y == '':
                    continue
                else:
                    current_node = (int(x),int(y))
                    graph[current_node] = {}
                    for dx, dy in directions:
                        neighbor_x, neighbor_y = int(x) + dx, int(y) + dy
                        if str(neighbor_x) not in x_index or str(neighbor_y) not in y_index:
                            continue
                        else:
                            neighbor_node = (neighbor_x, neighbor_y)
                            current_elevation = float(all_rows[y_index.index(y)][x_index.index(x)])
                            neighbor_elevation = float(all_rows[y_index.index(str(neighbor_y))][x_index.index(str(neighbor_x))])
                            elevation_difference = neighbor_elevation - current_elevation
                            if elevation_difference > 0:
                                weight = ((dx**2 + dy**2)**0.5) +(elevation_difference*10)
                            else:
                                weight = ((dx**2 + dy**2)**0.5)
                            graph[current_node].update({neighbor_node:weight})

# Find the shortest path from (x, y) to (x+dx, y+dy)
src = (0,0)
dst = (90,50)
shortest_distance = dijkstra(graph, src, dst)

if shortest_distance is not None:
    print("Shortest distance from {} to {}:".format(src,dst), shortest_distance)
else:
    print("There is no path from {} to {}.".format(src,dst))
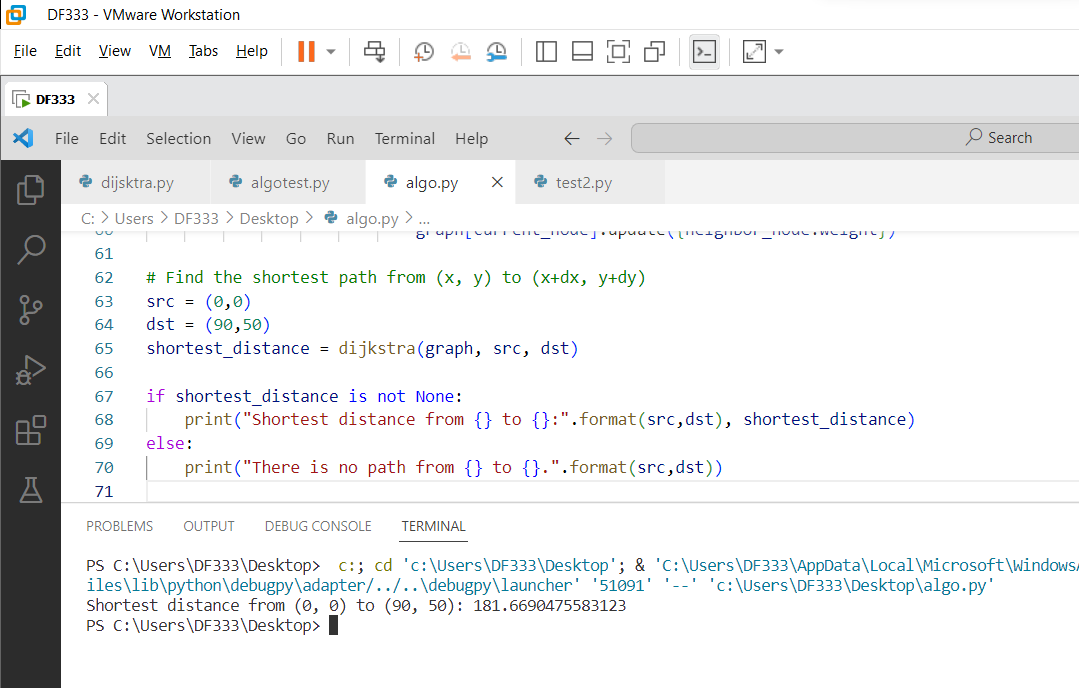
Ran the python script.
Therefore, the lowest cost is 181.66905 (5dp).
Round to 1 decimal place means answer is 181.7.


